Note
Go to the end to download the full example code
Enumeration of alkane isomers#
The purpose of this example is to demonstrate the capabilities of the PubChem interface. As a toy application, the following code should find and visualize the isomers of alkanes up to a certain carbon atom number. Although there are more sophisticated methods to obtain an exhausting isomer enumeration for an arbitrary number of carbon atoms, this script achieves the aim merely using PubChem: Isomers are found by searching for compounds with a given molecular formula in the database and filtering them by some properties provided by PubChem.
At first all compound IDs (CIDs), that match the formula of a certain
alkane, are queried using search().
To decrease the server load in the later filter steps, the CIDs will be
put into a single array accompanied by another array that contains the
number of carbon atoms for each CID.
This way subsequent queries can be achieved with a single request as
opposed to one request per carbon number.
import matplotlib.pyplot as plt
import numpy as np
import biotite.database.pubchem as pubchem
import biotite.structure as struc
import biotite.structure.io.mol as mol

MAX_CARBON_COUNT = 12
PLOT_MAX_CARBON_COUNT = 6


carbon_numbers = []
alkane_cids = []
for n_carbon in range(1, MAX_CARBON_COUNT + 1):
    formula = f"C{n_carbon}H{2 * n_carbon + 2}"
    print(formula)
    cids = np.array(pubchem.search(pubchem.FormulaQuery(formula)))
    carbon_numbers.extend([n_carbon] * len(cids))
    alkane_cids.extend(cids)
carbon_numbers = np.array(carbon_numbers)
alkane_cids = np.array(alkane_cids)
C1H4
C2H6
C3H8
C4H10
C5H12
C6H14
C7H16
C8H18
C9H20
C10H22
C11H24
C12H26
Although all compounds with the same formula are technically isomers,
some extra filtering needs to performed to remove unexpected results:
Specifically a lot of isomers from PubChem refer to the same
molecule with different isotopes or (de)protonated versions.
To find quickly which CIDs match the requirements, the properties
referring to the presence of isotopes and charges are downloaded
using fetch_property().
The obtained property lists are put into an NumPy array with
appropriate data type and used for filtering.
Finally, also the IUPAC name for each remaining compound is retrieved
to review the results.
# Filter natural isotopes...
n_isotopes = np.array(
    pubchem.fetch_property(alkane_cids, "IsotopeAtomCount"), dtype=int
)
# ...and neutral compounds
charge = np.array(pubchem.fetch_property(alkane_cids, "Charge"), dtype=int)
# Apply filter
mask = (n_isotopes == 0) & (charge == 0)
carbon_numbers = carbon_numbers[mask]
alkane_cids = alkane_cids[mask]
# Get the IUPAC names for each compound
iupac_names = pubchem.fetch_property(alkane_cids, "IUPACName")
for name in iupac_names[:10]:
    print(name)
methane
ethane
propane
ethene;methane
molecular hydrogen;prop-1-ene
carbanide;ethane
butane
2-methylpropane
methane;prop-1-ene
ethane;ethene
The compound names contain some odd results:
Some entries contain multiple molecules, separated by an ;.
Indeed, PubChem compounds may contain multiple molecules, which is
undesirable for this use case.
Hence, compounds with multiple molecules are removed.
# Remove compounds containing multiple molecules
# (indicated by the ';' as separator between molecule names)
single_molecule_mask = np.array([";" not in name for name in iupac_names])
# Some compounds containing multiple molecules have no name at all
single_molecule_mask &= np.array([len(name) != 0 for name in iupac_names])
carbon_numbers = carbon_numbers[single_molecule_mask]
alkane_cids = alkane_cids[single_molecule_mask]
iupac_names = np.array(iupac_names)[single_molecule_mask]
for n_carbon, cid, name in zip(carbon_numbers, alkane_cids, iupac_names):
    # For the sake of brevity limit this table printout to small alkanes
    if n_carbon <= PLOT_MAX_CARBON_COUNT:
        print(f"{n_carbon:2d} {cid:10d} {name}")
1        297 methane
2       6324 ethane
3       6334 propane
4       7843 butane
4       6360 2-methylpropane
5       8003 pentane
5       6556 2-methylbutane
5      10041 2,2-dimethylpropane
6       8058 hexane
6       7892 2-methylpentane
6       7282 3-methylpentane
6       6403 2,2-dimethylbutane
6       6589 2,3-dimethylbutane
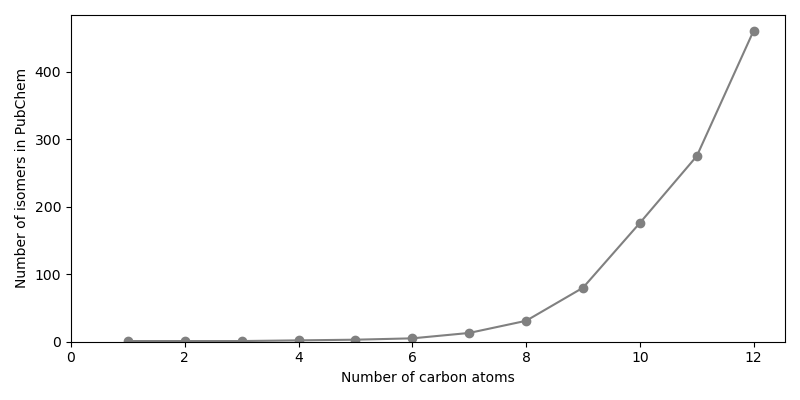
The number of isomers in PubChem might still sometimes exceed the natural number of isomers, as PubChem may contain e.g. duplicate records with and without stereochemical information. The removal of such records is out of scope for this example.
Now the number of isomers for alkanes with a certain number of carbon atoms are plotted.
# The first element is removed as it represents the number of isomers
# for alkanes with zero carbon atoms, which does not make sense
isomer_numbers = np.bincount(carbon_numbers)[1:]
fig, ax = plt.subplots(figsize=(8.0, 4.0))
ax.plot(np.arange(1, MAX_CARBON_COUNT + 1), isomer_numbers, marker="o", color="gray")
ax.set_xlim(left=0)
ax.set_ylim(bottom=0)
ax.set_xlabel("Number of carbon atoms")
ax.set_ylabel("Number of isomers in PubChem")
fig.tight_layout()

In the final step the structural formula of the isomers should be
visualized.
To this end, the 2D structures are downloaded using fetch().
The structures are loaded into an AtomArray and its
xy-coordinates are plotted as skeletal formula.
files = pubchem.fetch(
    alkane_cids[carbon_numbers <= PLOT_MAX_CARBON_COUNT], as_structural_formula=True
)

fig, axes = plt.subplots(
    nrows=np.max(isomer_numbers[:PLOT_MAX_CARBON_COUNT]),
    ncols=PLOT_MAX_CARBON_COUNT,
    figsize=(8.0, 6.0),
    sharex=True,
    sharey=True,
)
fig.suptitle("Number of carbon atoms", fontsize=16)
for i, n_carbon in enumerate(range(1, PLOT_MAX_CARBON_COUNT + 1)):
    axes[0, i].set_title(n_carbon, fontsize=12)
    indices_for_n_carbon = np.where(carbon_numbers == n_carbon)[0]
    for j, file_index in enumerate(indices_for_n_carbon):
        file = files[file_index]
        atoms = mol.MOLFile.read(file).get_structure()
        # Plot skeletal formula -> remove hydrogen
        atoms = atoms[atoms.element != "H"]
        # Center atoms in origin
        atoms.coord -= struc.centroid(atoms)
        # Structural formula is 0 in z-dimension
        coord = atoms.coord[:, :2]

        ax = axes[j, i]
        ax.plot(coord[:, 0], coord[:, 1], color="black", linestyle="None", marker="o")
        for bond_i, bond_j, _ in atoms.bonds.as_array():
            ax.plot(
                coord[[bond_i, bond_j], 0], coord[[bond_i, bond_j], 1], color="black"
            )

for ax in axes.flatten():
    ax.axis("off")
    ax.set_aspect("equal")
    ax.margins(0.1)
fig.subplots_adjust(hspace=0, wspace=0)
fig.tight_layout()

plt.show()
