Note
Go to the end to download the full example code
Dendrogram of a protein family#
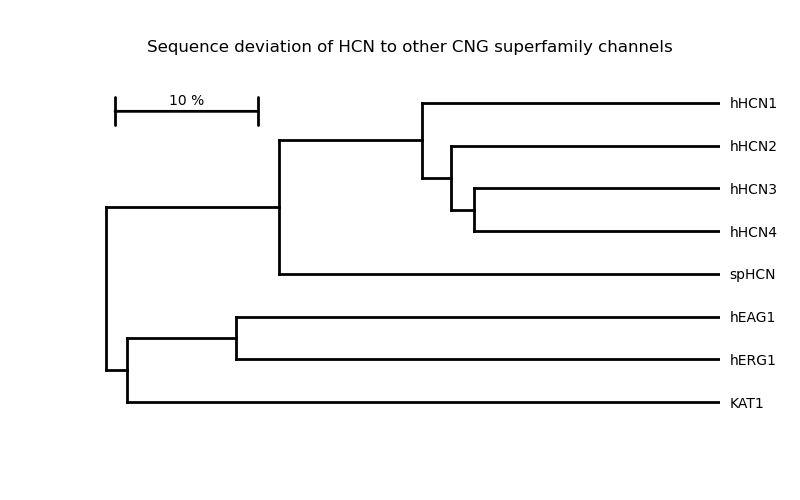
This example creates a simple dendrogram for HCN channels and other proteins of the cyclic nucleotide–gated (NCG) ion channel superfamily.
As distance measure the deviation from sequence identity is used: For identical sequences the deviation is 0 and for sequences with no similarity the deviation is 1. The tree is created using the UPGMA algorithm.

# Code source: Daniel Bauer
# License: BSD 3 clause

import matplotlib.pyplot as plt
import biotite.application.clustalo as clustalo
import biotite.database.entrez as entrez
import biotite.sequence as seq
import biotite.sequence.align as align
import biotite.sequence.graphics as graphics
import biotite.sequence.io.fasta as fasta
import biotite.sequence.phylo as phylo

UNIPROT_IDS = dict(
    hHCN1="O60741",
    hHCN2="Q9UL51",
    hHCN3="Q9P1Z3",
    hHCN4="Q9Y3Q4",
    spHCN="O76977",
    hEAG1="O95259",
    hERG1="Q12809",
    KAT1="Q39128",
)


### fetch sequences for UniProt IDs from NCBI Entrez
fasta_file = fasta.FastaFile.read(
    entrez.fetch_single_file(list(UNIPROT_IDS.values()), None, "protein", "fasta")
)
sequences = {
    name: seq.ProteinSequence(seq_str)
    for name, seq_str in zip(UNIPROT_IDS.keys(), fasta_file.values())
}

### create a simple phylogenetic tree
# create MSA
alignment = clustalo.ClustalOmegaApp.align(list(sequences.values()))
# build simple tree based on deviation from sequence identity
distances = 1 - align.get_pairwise_sequence_identity(alignment, mode="shortest")
tree = phylo.upgma(distances)


### plot the tree
fig, ax = plt.subplots(1, 1, figsize=(8, 5))
graphics.plot_dendrogram(
    ax,
    tree,
    orientation="left",
    labels=list(UNIPROT_IDS.keys()),
    show_distance=False,
    linewidth=2,
)
ax.grid(False)
ax.set_xticks([])

# distance indicator
indicator_len = 0.1
indicator_start = (
    ax.get_xlim()[0] + ax.get_xlim()[1] * 0.02,
    ax.get_ylim()[1] - ax.get_ylim()[1] * 0.15,
)
indicator_stop = (indicator_start[0] + indicator_len, indicator_start[1])
indicator_center = (
    (indicator_start[0] + indicator_stop[0]) / 2,
    (indicator_start[1] + 0.25),
)
ax.annotate(
    "",
    xy=indicator_start,
    xytext=indicator_stop,
    xycoords="data",
    textcoords="data",
    arrowprops={"arrowstyle": "|-|", "linewidth": 2},
)
ax.annotate(
    f"{int(indicator_len * 100)} %", xy=indicator_center, ha="center", va="center"
)
ax.set_title("Sequence deviation of HCN to other CNG superfamily channels")

plt.show()