Note
Go to the end to download the full example code
Visualization of glycosylated amino acids#
In this example we will visualize the glycosylation of amino acid residues in an arbitrary protein.
At first we need a catalogue of residue names that belong to saccharides. To create such a list can be quiet tedious, as each saccharide can be splitted into its pyranose or furanose form or into its \(\alpha\) or \(\beta\) anomer. And sometimes a residue comprises multiple connected monosaccharides. Luckily, this work has already been done, for example by the Mol* software team.
# Code source: Patrick Kunzmann
# License: BSD 3 clause

import matplotlib.pyplot as plt
import networkx as nx
import numpy as np
from matplotlib.lines import Line2D
from networkx.drawing.nx_pydot import graphviz_layout
import biotite.database.rcsb as rcsb
import biotite.sequence as seq
import biotite.structure as struc
import biotite.structure.io.pdbx as pdbx

# Adapted from "Mol*" Software
# The dictionary maps residue names of saccharides to their common names
SACCHARIDE_NAMES = {
    res_name: common_name
    for common_name, res_names in [
        ("Glc", ["GLC", "BGC", "Z8T", "TRE", "MLR"]),
        ("Man", ["MAN", "BMA"]),
        ("Gal", ["GLA", "GAL", "GZL", "GXL", "GIV"]),
        ("Gul", ["4GL", "GL0", "GUP", "Z8H"]),
        ("Alt", ["Z6H", "3MK", "SHD"]),
        ("All", ["AFD", "ALL", "WOO", "Z2D"]),
        ("Tal", ["ZEE", "A5C"]),
        ("Ido", ["ZCD", "Z0F", "4N2"]),
        ("GlcNAc", ["NDG", "NAG", "NGZ"]),
        ("ManNAc", ["BM3", "BM7"]),
        ("GalNAc", ["A2G", "NGA", "YYQ"]),
        ("GulNAc", ["LXB"]),
        ("AllNAc", ["NAA"]),
        ("IdoNAc", ["LXZ"]),
        ("GlcN", ["PA1", "GCS"]),
        ("ManN", ["95Z"]),
        ("GalN", ["X6X", "1GN"]),
        ("GlcA", ["GCU", "BDP"]),
        ("ManA", ["MAV", "BEM"]),
        ("GalA", ["ADA", "GTR", "GTK"]),
        ("GulA", ["LGU"]),
        ("TalA", ["X1X", "X0X"]),
        ("IdoA", ["IDR"]),
        ("Qui", ["G6D", "YYK"]),
        ("Rha", ["RAM", "RM4", "XXR"]),
        ("6dGul", ["66O"]),
        ("Fuc", ["FUC", "FUL", "FCA", "FCB"]),
        ("QuiNAc", ["Z9W"]),
        ("FucNAc", ["49T"]),
        ("Oli", ["DDA", "RAE", "Z5J"]),
        ("Tyv", ["TYV"]),
        ("Abe", ["ABE"]),
        ("Par", ["PZU"]),
        ("Dig", ["Z3U"]),
        ("Ara", ["64K", "ARA", "ARB", "AHR", "FUB", "BXY", "BXX"]),
        ("Lyx", ["LDY", "Z4W"]),
        ("Xyl", ["XYS", "XYP", "XYZ", "HSY", "LXC"]),
        ("Rib", ["YYM", "RIP", "RIB", "BDR", "0MK", "Z6J", "32O"]),
        ("Kdn", ["KDM", "KDN"]),
        ("Neu5Ac", ["SIA", "SLB"]),
        ("Neu5Gc", ["NGC", "NGE"]),
        ("LDManHep", ["GMH"]),
        ("Kdo", ["KDO"]),
        ("DDManHep", ["289"]),
        ("MurNAc", ["MUB", "AMU"]),
        ("Mur", ["1S4", "MUR"]),
        ("Api", ["XXM"]),
        ("Fru", ["BDF", "Z9N", "FRU", "LFR"]),
        ("Tag", ["T6T"]),
        ("Sor", ["SOE"]),
        ("Psi", ["PSV", "SF6", "SF9"]),
    ]
    for res_name in res_names
}
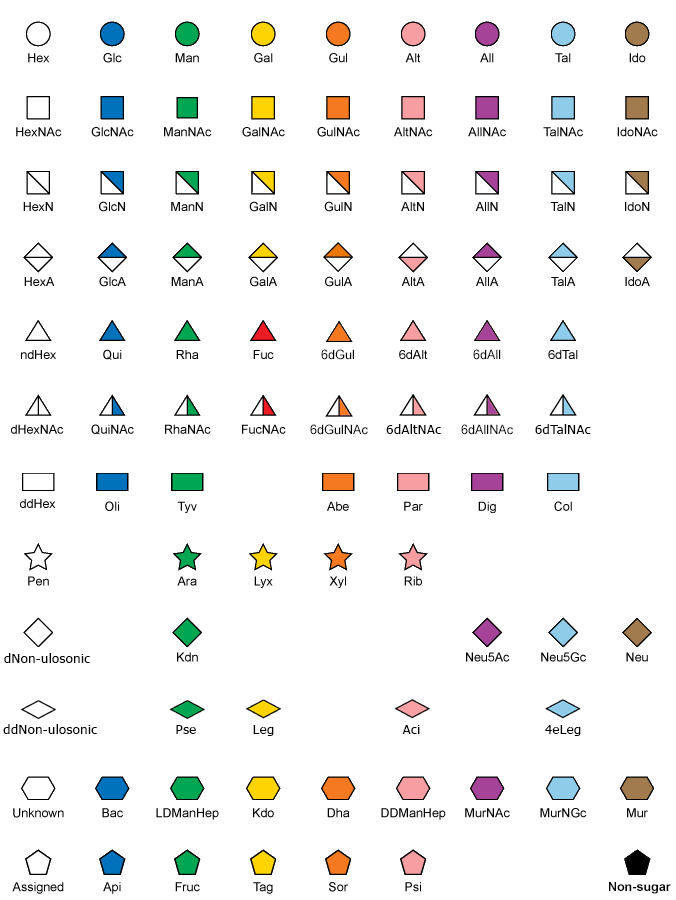
We want to give each saccharide symbol an unique color-shape combination in our plot. We will use the symbol nomenclature defined here:

Matplotlib supports most of these symbols as plot markers out of the box. However, some of the symbols, especially the half-filled ones, are not directly supported. We could create custom vertices to include these shapes, but for the sake of brevity we will simply use other shapes in these cases.
SACCHARIDE_REPRESENTATION = {
    "Glc": ("o", "royalblue"),
    "Man": ("o", "forestgreen"),
    "Gal": ("o", "gold"),
    "Gul": ("o", "darkorange"),
    "Alt": ("o", "pink"),
    "All": ("o", "purple"),
    "Tal": ("o", "lightsteelblue"),
    "Ido": ("o", "chocolate"),
    "GlcNAc": ("s", "royalblue"),
    "ManNAc": ("s", "forestgreen"),
    "GalNAc": ("s", "gold"),
    "GulNAc": ("s", "darkorange"),
    "AllNAc": ("s", "purple"),
    "IdoNAc": ("s", "chocolate"),
    "GlcN": ("1", "royalblue"),
    "ManN": ("1", "forestgreen"),
    "GalN": ("1", "gold"),
    "GlcA": ("v", "royalblue"),
    "ManA": ("v", "forestgreen"),
    "GalA": ("v", "gold"),
    "GulA": ("v", "darkorange"),
    "TalA": ("v", "lightsteelblue"),
    "IdoA": ("v", "chocolate"),
    "Qui": ("^", "royalblue"),
    "Rha": ("^", "forestgreen"),
    "6dGul": ("^", "darkorange"),
    "Fuc": ("^", "crimson"),
    "QuiNAc": ("P", "royalblue"),
    "FucNAc": ("P", "crimson"),
    "Oli": ("X", "royalblue"),
    "Tyv": ("X", "forestgreen"),
    "Abe": ("X", "darkorange"),
    "Par": ("X", "pink"),
    "Dig": ("X", "purple"),
    "Ara": ("*", "forestgreen"),
    "Lyx": ("*", "gold"),
    "Xyl": ("*", "darkorange"),
    "Rib": ("*", "pink"),
    "Kdn": ("D", "forestgreen"),
    "Neu5Ac": ("D", "mediumvioletred"),
    "Neu5Gc": ("D", "turquoise"),
    "LDManHep": ("H", "forestgreen"),
    "Kdo": ("H", "gold"),
    "DDManHep": ("H", "pink"),
    "MurNAc": ("H", "purple"),
    "Mur": ("H", "chocolate"),
    "Api": ("p", "royalblue"),
    "Fru": ("p", "forestgreen"),
    "Tag": ("p", "gold"),
    "Sor": ("p", "darkorange"),
    "Psi": ("p", "pink"),
    # Default representation
    None: ("h", "black"),
}
Now that the basix data is prepared, we can load a protein structure for which we will display the glycosylation. Here we choose the glycosylated peroxidase 4CUO, as it contains a lot of glycans.
The resulting plot makes only sense for a single protein chain. In this case the peroxidase structure has only one chain. In other cases additional atom filtering would be necessary.
PDB_ID = "4CUO"

pdbx_file = pdbx.BinaryCIFFile.read(rcsb.fetch(PDB_ID, "bcif"))
structure = pdbx.get_structure(pdbx_file, model=1, include_bonds=True)
# We are not interested in water, ions, etc.
structure = structure[
    struc.filter_carbohydrates(structure) | struc.filter_amino_acids(structure)
]

# Recreate masks after atom selection for later use
is_glycan = struc.filter_carbohydrates(structure)
# ... or part of an amino acid
is_amino_acid = struc.filter_amino_acids(structure)
We will use the starting atom index, i.e. the atom index pointing to the first atom in a residue, as unambiguous identifier for the respective residue later. The residue ID is not sufficient here, because the same residue ID might appear in conjunction with different chain IDs.
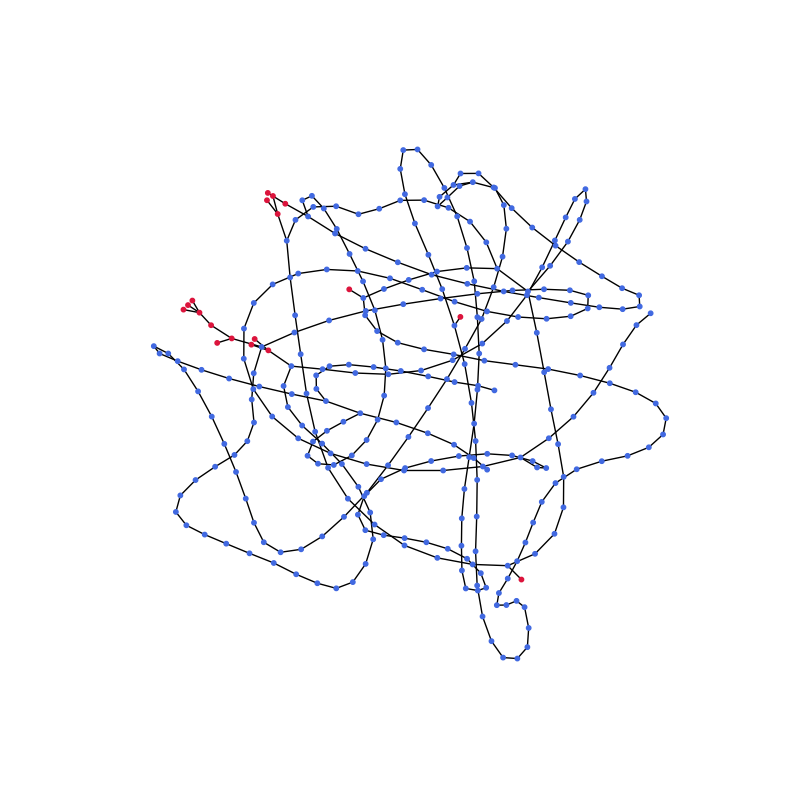
To determine which residues (including the saccharides) are connected with each other, we will use a graph representation: The nodes are residues, the edges indicate which residues are connected via covalent bonds.
We will use the starting atom index, i.e. the atom index pointing to the first atom in a residue, as unambiguous identifier for the respective residue. The residue ID is not sufficient here, because the same residue ID might appear in conjunction with different chain IDs.
# Create a graph that depicts which residues are connected
# Use residue IDs as nodes
graph = nx.Graph()
# Add all residues, i.e. their starting atom index,
# as initially disconnected nodes
graph.add_nodes_from(struc.get_residue_starts(structure))
# Convert BondList to array and omit bond order
bonds = structure.bonds.as_array()[:, :2]
# Convert indices pointing to connected atoms to indices pointing to the
# starting atom of the respective residue
connected = struc.get_residue_starts_for(structure, bonds.flatten()).reshape(
    bonds.shape
)
# Omit bonds within the same residue
connected = connected[connected[:, 0] != connected[:, 1]]
# Add the residue connections to the graph
graph.add_edges_from(connected)

fig, ax = plt.subplots(figsize=(8.0, 8.0))
nx.draw(
    graph,
    ax=ax,
    node_size=10,
    node_color=[
        "crimson" if is_glycan[atom_i] else "royalblue" for atom_i in graph.nodes()
    ],
)

So far, so good. We can already see glycans (red) on the long peptide chain (blue). In the final plot only the glycans should be highlighted. For this purpose the edges between all non-saccharides will be removed. The remaining subgraphs are either single nodes, representing now disconnected amino acids (or water, ions etc.), or small graphs, depicting glycans attached to their respective amino acid residue. We are only interested in the latter ones, so the subgraphs containing a single node are ignored.
# Remove edges between non-glycans
# As edges are removed while iterating over them,
# the edges are put into a list to avoid side effects
for atom_i, atom_j in list(graph.edges):
    if not is_glycan[atom_i] and not is_glycan[atom_j]:
        graph.remove_edge(atom_i, atom_j)

# Get connected subgraphs containing glycans
# -> any subgraph with more than one node
glycan_graphs = [
    graph.subgraph(nodes).copy()
    for nodes in nx.connected_components(graph)
    if len(nodes) > 1
]

for g in glycan_graphs:
    print([structure.res_name[atom_i] for atom_i in sorted(g.nodes())])
[np.str_('ASN'), np.str_('NAG'), np.str_('FUC')]
[np.str_('ASN'), np.str_('NAG'), np.str_('NAG'), np.str_('BMA'), np.str_('XYS'), np.str_('MAN'), np.str_('MAN'), np.str_('FUC')]
[np.str_('ASN'), np.str_('NAG'), np.str_('FUC'), np.str_('NAG')]
[np.str_('ASN'), np.str_('NAG')]
[np.str_('ASN'), np.str_('NAG'), np.str_('FUC'), np.str_('NAG')]
[np.str_('ASN'), np.str_('NAG')]
[np.str_('ASN'), np.str_('NAG')]
Now we can start plotting each of the glycans: At first an initial tree layout is created using the Graphviz software. Then the graph is repositioned on the x-axis to the position of corresponding amino acid residue ID. Eventually, the glycan graphs are drawn using the saccharide symbols.
fig, ax = plt.subplots(figsize=(8.0, 2.5))

# Some constants for the plot layout
NODE_SIZE = 50
HORIZONTAL_NODE_DISTANCE = 3
LINE_WIDTH = 0.5

# Plot each glycan graph individually
# Save the residue ID and 1-letter-symbol of each glycosylated
# amino acid for x-axis labels
glycosylated_residue_ids = []
glycosylated_residue_symbols = []
# Use node markers for the legend,
# use dictionary to avoid redundant entries
legend_elements = {}
for glycan_graph in glycan_graphs:
    # Convert into a directed graph for correct plot layout
    # The root of the plotted graph should be the amino acid, which has
    # almost always an atom index that is lower than the saccharides
    # attached to it
    glycan_graph = nx.DiGraph(
        [
            (min(atom_i, atom_j), max(atom_i, atom_j))
            for atom_i, atom_j in glycan_graph.edges()
        ]
    )

    # The 'root' is the amino acid
    root = [atom_i for atom_i in glycan_graph.nodes() if is_amino_acid[atom_i]]
    if len(root) == 0:
        # Saccharide is not attached to an amino acid -> Ignore glycan
        continue
    else:
        root = root[0]
    glycosylated_residue_ids.append(structure.res_id[root])
    glycosylated_residue_symbols.append(
        seq.ProteinSequence.convert_letter_3to1(structure.res_name[root])
    )

    # The saccharide directly attached to the amino acid
    root_neighbor = list(glycan_graph.neighbors(root))[0]

    # Position the nodes for the plot:
    # Create an initial tree layout and transform it afterwards,
    # so that each glycan graph is at the correct position and the
    # node distances are equal
    pos = graphviz_layout(glycan_graph, prog="dot")
    # 'graphviz_layout()' converts the nodes from integers to string
    # -> revert this conversion
    nodes = [int(key) for key in pos.keys()]
    # Convert dictionary to array
    pos_array = np.array(list(pos.values()))
    # Position the root at coordinate origin
    pos_array -= pos_array[nodes.index(root)]
    # Set vertical distances between nodes to 1
    pos_array[:, 1] /= (
        pos_array[nodes.index(root_neighbor), 1] - pos_array[nodes.index(root), 1]
    )
    # Set minimum horizontal distances between nodes to 1
    non_zero_dist = np.abs(pos_array[(pos_array[:, 0] != 0), 0])
    if len(non_zero_dist) != 0:
        pos_array[:, 0] *= HORIZONTAL_NODE_DISTANCE / np.min(non_zero_dist)
    # Move graph to residue ID position on x-axis
    pos_array[:, 0] += structure.res_id[root]
    # Convert array back to dictionary
    pos = {node: tuple(coord) for node, coord in zip(nodes, pos_array)}

    nx.draw_networkx_edges(
        glycan_graph, pos, ax=ax, arrows=False, node_size=0, width=LINE_WIDTH
    )

    # Draw each node individually
    for atom_i in glycan_graph.nodes():
        # Only plot glycans, not amino acids
        if not is_glycan[atom_i]:
            continue

        # Now the above data sets come into play
        common_name = SACCHARIDE_NAMES.get(structure.res_name[atom_i])
        shape, color = SACCHARIDE_REPRESENTATION[common_name]
        ax.scatter(
            pos[atom_i][0],
            pos[atom_i][1],
            s=NODE_SIZE,
            marker=shape,
            facecolor=color,
            edgecolor="black",
            linewidths=LINE_WIDTH,
        )
        legend_elements[common_name] = Line2D(
            [0],
            [0],
            label=common_name,
            linestyle="None",
            marker=shape,
            markerfacecolor=color,
            markeredgecolor="black",
            markeredgewidth=LINE_WIDTH,
        )


ax.legend(handles=legend_elements.values(), loc="upper right")

# Show the bottom x-axis with glycosylated residue positions
ax.spines["left"].set_visible(False)
ax.spines["right"].set_visible(False)
ax.spines["top"].set_visible(False)
ax.spines["bottom"].set_visible(True)
ax.tick_params(axis="x", bottom=True, labelbottom=True)
ax.tick_params(axis="y", left=False, labelleft=False)
ax.set_xticks(glycosylated_residue_ids)
ax.set_xticklabels(
    [
        symbol + str(res_id)
        for symbol, res_id in zip(
            glycosylated_residue_symbols, glycosylated_residue_ids
        )
    ],
    rotation=45,
)

# Set the end of the axis to the last amino acid
ax.set_xlim(1, np.max(structure.res_id[is_amino_acid]))
ax.set_ylim(0, 7)
ax.set_title(pdbx_file.block["struct"]["title"].as_item())
fig.tight_layout()

plt.show()

/home/runner/work/biotite/biotite/doc/examples/scripts/structure/misc/glycan_visualization.py:318: DeprecationWarning: nx.nx_pydot.graphviz_layout depends on the pydot package, which has known issues and is not actively maintained. Consider using nx.nx_agraph.graphviz_layout instead.
See https://github.com/networkx/networkx/issues/5723
pos = graphviz_layout(glycan_graph, prog="dot")