Note
Go to the end to download the full example code
Polymorphisms in a gene#
The THCA synthase catalyzes the last step in the synthesis of tetrahydrocannabinolic acid (THCA), the precursor molecule of tetrahydrocannabinol (THC).
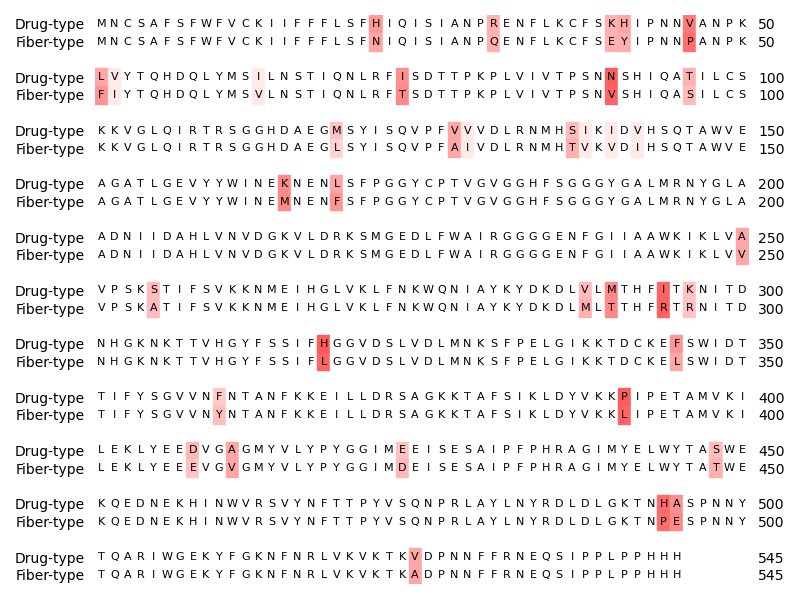
Two types of cannabis sativa are distinguished: While the drug-type strains produce high levels of THCA, fiber-type strains produce a low amount. One molecular difference between these two types are polymorphisms in THCA synthase gene [1].
This script takes THCA synthase gene sequences from different cannabis sativa strains, translates them into protein sequences and creates a consensus sequence for each of the two strain types. Eventually, an alignment is plotted depicting the polymorphic positions between the two consensus sequences.

# Code source: Patrick Kunzmann
# License: BSD 3 clause

import matplotlib.pyplot as plt
import numpy as np
from matplotlib.colors import LinearSegmentedColormap
import biotite.database.entrez as entrez
import biotite.sequence as seq
import biotite.sequence.align as align
import biotite.sequence.graphics as graphics
import biotite.sequence.io.genbank as gb

# Search for DNA sequences that belong to the cited article
query = (
    entrez.SimpleQuery("Forensic Sci. Int.", "Journal")
    & entrez.SimpleQuery("159", "Volume")
    & entrez.SimpleQuery("132-140", "Page Number")
)
uids = entrez.search(query, db_name="nuccore")

# Download and read file containing the Genbank records for the THCA
# synthase genes
multi_file = gb.MultiFile.read(
    entrez.fetch_single_file(uids, file_name=None, db_name="nuccore", ret_type="gb")
)


# This dictionary maps the strain ID to the protein sequence
sequences = {}

for gb_file in multi_file:
    annotation = gb.get_annotation(gb_file)

    # Find ID of strain in 'source' feature
    strain = None
    for feature in annotation:
        if feature.key == "source":
            strain = int(feature.qual["strain"])
    assert strain is not None

    # Find corresponding protein sequence in 'CDS' feature
    sequence = None
    for feature in annotation:
        if feature.key == "CDS":
            sequence = seq.ProteinSequence(
                # Remove whitespace in sequence
                # resulting from line breaks
                feature.qual["translation"].replace(" ", "")
            )
    assert sequence is not None

    sequences[strain] = sequence


# None of the THCA synthase variants have an insertion or deletion
# -> each one should have the same sequence length
seq_len = len(list(sequences.values())[0])
for sequence in sequences.values():
    assert len(sequence) == seq_len


# Create consensus sequences for the drug-type and fiber-type cannabis
# strains
def create_consensus(sequences):
    seq_len = len(sequences[0])
    consensus_code = np.zeros(seq_len, dtype=int)
    for seq_pos in range(seq_len):
        # Count the number of occurrences of each amino acid
        # at the given sequence position
        counts = np.bincount([sequence.code[seq_pos] for sequence in sequences])
        # The consensus amino acid is the most frequent amino acid
        consensus_code[seq_pos] = np.argmax(counts)
    # Create empty ProteinSequence object...
    consensus_sequence = seq.ProteinSequence()
    # ...and fill it with the sequence code containing the consensus
    # sequence
    consensus_sequence.code = consensus_code
    return consensus_sequence


drug_type_consensus = create_consensus(
    [sequences[strain] for strain in (1, 10, 13, 20, 53, 54)]
)
fiber_type_consensus = create_consensus(
    [sequences[strain] for strain in (9, 5, 11, 45, 66, 68, 78)]
)


# Create an alignment for visualization purposes
# No insertion/deletions -> Align ungapped
matrix = align.SubstitutionMatrix.std_protein_matrix()
alignment = align.align_ungapped(
    drug_type_consensus, fiber_type_consensus, matrix=matrix
)

# A colormap for hightlighting sequence dissimilarity:
# At low similarity the symbols are colored red,
# at high similarity the symbols are colored white
cmap = LinearSegmentedColormap.from_list(
    "custom",
    colors=[(1.0, 0.3, 0.3), (1.0, 1.0, 1.0)],
    #                    ^ reddish        ^ white
)

fig = plt.figure(figsize=(8.0, 6.0))
ax = fig.add_subplot(111)

graphics.plot_alignment_similarity_based(
    ax,
    alignment,
    matrix=matrix,
    symbols_per_line=50,
    labels=["Drug-type", "Fiber-type"],
    show_numbers=True,
    cmap=cmap,
    symbol_size=8,
)

fig.tight_layout()

plt.show()