Note
Go to the end to download the full example code
Phylogenetic tree of a protein family#
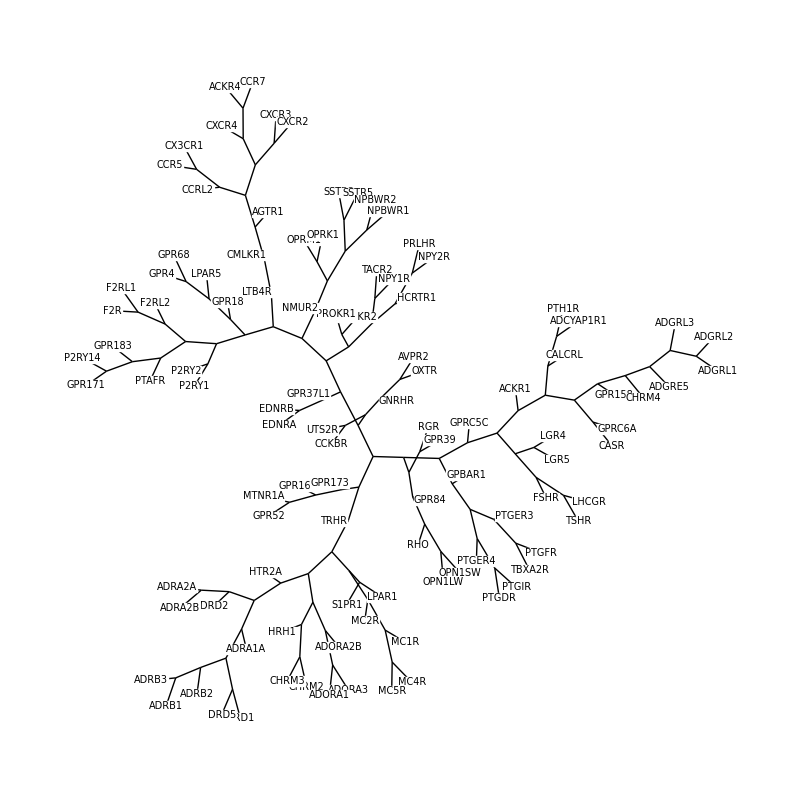
This example plots an unrooted phylogenetic tree depicting the evolution of different G-protein coupled receptors (GPCRs).
The UniProt IDs and gene names of the GPCRs are obtained via the corresponding keyword. The corresponding sequences are downloaded and aligned. Based on the pairwise sequence identity in the multiple sequence alignment a tree is created via the neighbor-joining method. Finally the unrooted tree is plotted using the graph drawing capabilities of the NetworkX package.

# Code source: Patrick Kunzmann
# License: BSD 3 clause

import re
import matplotlib.pyplot as plt
import networkx as nx
import biotite.application.clustalo as clustalo
import biotite.database.uniprot as uniprot
import biotite.sequence as seq
import biotite.sequence.align as align
import biotite.sequence.io.fasta as fasta
import biotite.sequence.phylo as phylo

# The bovine GPCRs are investigated
SPECIES = "Bovine"


query = (
    uniprot.SimpleQuery("reviewed", "true")
    &
    # Bovine proteins
    uniprot.SimpleQuery("organism_name", "Bos taurus")
    &
    # Keyword ID for GPCRs
    uniprot.SimpleQuery("keyword", "KW-0297")
)
ids = uniprot.search(query)


# Download sequence files and read the sequences from it
genes = []
sequences = []
# RegEx pattern used to extract the gene name from fasta header
gene_name_pattern = "(?<=GN=)[0-9A-Za-z]+"
for file in uniprot.fetch(ids, "fasta"):
    fasta_file = fasta.FastaFile.read(file)
    # There is only one entry in file
    for header, seq_str in fasta_file.items():
        genes.append(re.search(gene_name_pattern, header).group(0))
        sequences.append(seq.ProteinSequence(seq_str))


# Create multiple sequence alignment with Clustal Omega
alignment = clustalo.ClustalOmegaApp.align(sequences)


# The distance measure required for the tree calculation is the
# percentage of non-identical amino acids in the respective two
# sequences
distances = 1 - align.get_pairwise_sequence_identity(alignment, mode="shortest")
# Create tree via neighbor joining
tree = phylo.neighbor_joining(distances)
# Convert to NetworkX graph
# For the graph visualization, the edge directions are unnecessary
graph = tree.as_graph().to_undirected()

fig = plt.figure(figsize=(8.0, 8.0))
ax = fig.gca()
ax.axis("off")
# Calculate position of nodes in the plot
pos = nx.kamada_kawai_layout(graph)
# Assign the gene names to the nodes that represent a reference index
node_labels = {i: name for i, name in enumerate(genes)}
nx.draw_networkx_edges(graph, pos, ax=ax)
nx.draw_networkx_labels(
    graph,
    pos,
    ax=ax,
    labels=node_labels,
    font_size=7,
    # Draw a white background behind the labeled nodes
    # for better readability
    bbox=dict(pad=0, color="white"),
)
fig.tight_layout()

plt.show()